11 Representation
11.1 How many non-binary/transgender dancers are there in American ballet?
See our section on how we record gender.
In our analyses up to the 2022 - 2023 season, we recorded 5 non-binary dancer in our dataset. This number has increased from 1 recorded dancer in the 2021-2022 season.
This is an underestimate: dancers may be missing in our various analyses due to 1. not having bios on company websites at the time of data collection (January 1st of last season) or 2. being a rank we typically exclude from analyses (apprentices at certain companies). Our data undercounts non-binary representation in American classical ballet, given that companies known for challenging gender norms (for example, Ballet22) are not included in our dataset. As a reminder, our analysis is limited to 26 companies with the largest domestic budgets in the 2018-2019 season.
We acknowledge that errors likely exist in our data. We use pronouns or gender expression to identify dancer gender. There may be inaccuracies related to non-binary individuals or others whose gender presentation on their employer’s website does not accurately reflect their gender; available online information may have changed since the gender identity for a dancer was first recorded. We continually strive to improve the quality of our data to accurately record dancer gender.
We do not currently gather data on transgender dancers.
Interpret with caution: We use pronouns or gender presentation to identify dancer gender; there may be inaccuracies related to non-binary individuals or others whose gender presentation on their employer’s website does not accurately reflect their gender. Also, information may have changed since gender identity for a dancer was first recorded.
11.2 What countries and states do dancers come from?
We currently only have this data for the 2018-2019 Season for the top seven companies.
Out of 460 dancers in the top seven American ballet companies during the 2018-2019 Season, 160 were born outside of the United States (34.78%).
From the Ballets Russes to today’s global company rosters, elite ballet has long been an international endeavor. Competitions, international company auditions, and video auditions allow foreign-born talent to more effectively seek jobs in US companies.
11.2.0.1 Number of Dancers From Season 2018-2019 Broken Down By Birth Place
11.2.1 Differences Seen in Gender and Company
34.78% of dancers this season were born in another country. More foreign males are recruited than foreign females (89 men to 71 women). Foreign-born dancers are also unequally distributed between ranks. Foreign-born dancers are slightly more likely to be a principal dancer than expected. Out of principal dancers, 36 were born in a different country out of 91 principal dancers (0.4% with all principals making up 0.2 of dancers).
Hiring also varies by company. Joffrey Ballet and San Francisco Ballet actually employ more foreign-born than US-born dancers while Houston Ballet has roughly equal numbers. As the Balanchine style has historic roots in the United States, the two Balanchine companies – New York City Ballet and Pacific Northwest Ballet – understandably have the lowest numbers of foreign-born dancers (less than 10% of the company). When Balanchine companies are excluded from analysis, the percentage of foreign-born dancers in top companies dramatically increases.
11.2.2 Representation
Which non-US countries are most represented in the largest US ballet companies? Japanese-born dancers, specifically Japanese-born females, are the most represented.

To the right, we can see the percentages of foreign-born dancers and how they compare to the percentage of immigrants in the US from each country. Shown here are the top ten countries of origin in terms of largest numbers of dancers, plus Mexico.
Out of overrepresented countries, Japan has the greatest difference in percentages between the total foreign-born US population and foreign-born top dancers while China and Cuba have the least. Mexican-born dancers are greatly underrepresented with a difference of nearly 25%. These differences are driven by the low number of Japanese immigrants and the high number of Mexican immigrants to the US.
Also note that Russian-born dancers do not show up in the top ten countries in terms of number. While there are several prominent Russian-born dancers in American companies, it seems the ballet powerhouse keeps its talent to itself for the most part.
Interpret with caution: While comparing percentages of dancers to US demographics is one way of looking at relative representation, it does not necessarily reflect equity for minority groups in ballet. Groups can be overrepresented relative to demographics but be underrepresented overall.
11.2.3 Final Thoughts
The information here has some caveats. This data is based on birthplaces found in dancers’ company profiles. Some newly joined dancers did not have this information available, so they were excluded. Being born in a different country does not preclude a dancer from being a US citizen. Dancers may also have moved to and trained in the US when they were young.
This information touches on issues like diversity and representation in ballet, issues repeatedly subject to debate regarding their relevance to the art form. For more information on race rather than country of birth, check out work from Memoirs of Blacks in Ballet and Final Bow for Yellowface (or their new non-profit, Gold Standard Arts Foundation).
11.3 How many Black dancers are there in American ballet?
We currently only have this data for the 2019-2020 Season for the top 25 companies by budget.
Memoirs of Blacks in Ballet seeks to amplify the voices and history of Black ballet dancers. The initiative maintains a list of current and past Black ballet dancers – the Roll Call. By combining the Roll Call with Data Pointes’ data from the 2019–2020 rosters of the largest 26 ballet companies by budget, we can quantitatively study Black representation in ballet. Our findings reveal the “Missing 53” – the approximate number of Black dancers needed to mend the disparity in Black representation in the largest US ballet companies.
11.3.1 Results
Between the 2018–2019 and 2019–2020 Seasons, no additional Black dancers (dancers appearing on the Roll Call) were hired by the top seven US ballet companies (American Ballet Theatre, Boston Ballet, Houston Ballet, New York City Ballet, Pacific Northwest Ballet, San Francisco Ballet, and The Joffrey Ballet). Additionally, no Black dancers employed by the top seven were fired between seasons. (The sole change in the number of listed dancers was due to the firing and reinstatement of Amar Ramasar for the 2019–2020 season. As these events occurred within the seasons, he was included in the calculations below.) Analysis includes all ranks: unranked, apprentices, corps, all soloist tiers, and principals.
% Black Dancers in the top seven (both 2018–2019 and 2019–2020) = 31/467 = 6.63%
% Female Black dancers of all female dancers in the top seven (2018–2020) = 14/254 = 5.51%
% Male Black dancers of all male dancers in the top seven (2018–2020) = 17/213 = 7.98%
We repeated these calculations for the largest 25 US ballet companies by domestic operating budget and the Dance Theatre of Harlem (DTH) for Season 2019–2020. DTH is not part of our list of top 25 companies by budget. Our analysis only includes unranked dancers, corps, all soloist tiers, and principals due to incomplete data on apprentices and second companies. Guest principals were also excluded.
% Black dancers in the top 25 + DTH (2019–2020) = 67/1000 = 6.70%
% Female Black dancers of all female dancers in the top 25 + DTH (2019–2020) = 30/535 = 5.61%
% Male Black dancers of all male dancers in the top 25 + DTH (2019–2020) = 37/465 = 7.96%
Finally, we calculated these estimates with only the top 25 companies ranked by domestic operating budgets (with Dance Theater of Harlem removed).
% Black dancers in the top 25 (2019–2020) = 54/981 = 5.50%
% Female Black dancers of all female dancers in the top 25 (2019–2020) = 24/526 = 4.56%
% Male Black dancers of all male dancers in the top 25 (2019–2020) = 30/455 = 6.59%
11.3.2 Assessing the relationship between Black identity and rank in the top 25
companies and Dance Theater of Harlem.
A Chi Square Test of Independence was performed to see if Black identity and company rank were independent. Conditions to run a Chi Square test were met as all expected counts were greater than 5. A statistically significant relationship between being Black and rank was observed – X2 (df = 3, N = 1000) = 9.08, p = 0.02822.
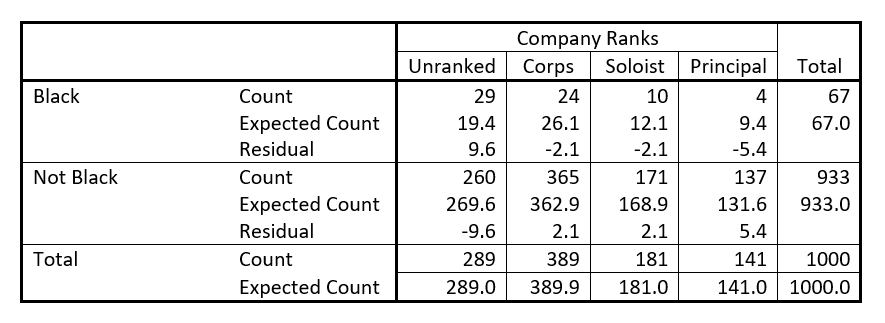
Fewer Black principal dancers are observed than expected if race and rank were independent. Additionally, more Black unranked dancers are observed than would be expected (likely driven by our inclusion of Dance Theatre of Harlem, which employs more Black ballet dancers than any other included company and has an unranked company structure).
However, post hoc tests with Bonferroni correction did not yield any statistically significant ranks. Due to the small size of the study population (Black ballet dancers in the 26 American ballet companies examined) and how racial identity was determined for this study, the significance of these results are inconclusive and warrant additional studies to understand the relationship between Black identity and rank in ballet companies.
11.3.3 Discussion
Consider how these percentages relate to the Black or African American population in the US. While self-reported Black or African American individuals make up roughly 12% of the US population according to the 2010 US Census, the estimates presented (roughly 7%) fall below this value. With 1000 main company dancers in the 26 companies analyzed, there should be 120 Black ballet dancers for Black representation in ballet to match overall US demographic data. With only 67 Black dancers in the 26 companies, there would need to be 53 additional Black dancers employed to make up the deficit – the “Missing 53.”
There was variability in numbers of Black dancers based on gender and company. In all samples, Black male representation is greater than Black female representation. Additionally, the inclusion of Dance Theater of Harlem greatly increased the percentage of Black dancers within the sample. Results indicated highly variable levels of Black representation between companies with some employing no Black dancers, limiting the visibility of Black dancers among certain audiences.
The largest 25 companies represent a significant portion of American ballet, servicing a large portion of American ballet’s audiences. To our knowledge, these estimates are the most comprehensive and current estimates of Black representation in ballet available. Longitudinal tracking of these metrics will improve transparency for the American ballet industry as a whole and assess retention of Black artists through the ballet pipeline.
However, these results have several caveats. The MOBBallet Roll Call utilizes a mix of voluntary and crowdsourced reports to build its dancer list. Consequently, some dancers who self-identify as Black and are in one of the 26 companies may not be included in our numbers, particularly if dancers are unaware of or choose not to participate in the MOBBallet initiative. Additionally, the Roll Call combines self-reported and perceived race, complicating our understanding of results. Perceived race (how others classify an individual’s race) is important due to the visual nature of ballet, but it ignores the complexities of racial identity for which self-reporting accounts.
Finally, second companies and apprentices were excluded from analysis due to missing data. As some of the least visible positions within a ballet company, these ranks represent important milestones in the ballet pipeline – serving as trial periods for retention in the corps. These ranks are the most variable from season to season and likely include Black dancers yet to be added to the Roll Call, potentially biasing the estimate downwards. Limiting analysis to higher ranks partially addresses these issues.
Overall, these caveats suggest the produced estimates slightly underestimate Black representation.