Company size of the largest 26 US ballet companies by domestic budget. We did not collect data for Milwaukee Ballet for the 2019 - 2020 season. Does not include second company programs, NYCB apprentices, or special ranks (like guest principal). These numbers may be off by a few dancers due to late joiners or people who are part of multiple companies.
9.1.0.1 Company Size Over Seasons
viewof compN = Inputs.checkbox( ["HB","SFB","NYCB","PNB","ABT","BB","JB","MCB","PAB","BW","KCB","ATL","PBT","WB","CB","DB","BAZ","TBT","COB","SARA","AUS","CHAR","TB","RICH","OBT","MB"], { value: ["ABT"],label:"Companies:" })filteredData =transpose(dataCR).filter(function(dancer) {return compN.includes(dancer.Company);})Plot.plot({y: {grid:true,domain: [0,120] },marks: [ Plot.line(filteredData, {x:"Season",y:"# of Dancers",stroke:"Company",strokeWidth:2,curve:"linear" }), Plot.dot(filteredData, {x:"Season",// feature for the x channely:"# of Dancers",// feature for the y channelfill:"Company",// feature for the stroke }), ],width:554,height:280,x: { ticks:3 },marginLeft:50,color: {legend:true,width:554,columns:"120px" }})
Above is a table tracking the sizes of our companies across seasons.
Danger
Interpret with caution: This information may miss some dancers for a variety of reasons. We collect company roster data on January 1st of each season. Sometimes, companies will not update rosters by this date. Dancers may also move or leave companies during seasons. Finally, companies may not report certain ranks some seasons, creating inconsistencies. For example, apprentice bios were not available for Pacific Northwest Ballet apprentices on January 1st, 2022.
The range in company size is staggering. ABT is over twice the size of PNB. A cursory glance at financial reports from around 2017-2018 indicates ABT has nearly twice the operating expenses of PNB (approximately $45 million to $25 million).
We break down company size by gender and rank below.
Number of dancers for each gender for the largest 26 US ballet companies by domestic budget. We did not collect data for Milwaukee Ballet for the 2019 - 2020 season. Does not include second company programs, NYCB apprentices, or special ranks (like guest principal). These numbers may be off by a few dancers due to late joiners or people who are part of multiple companies.
There are currently some inconsistencies in some of the Houston Ballet soloist ranks between seasons. We used to combine multiple soloist ranks together to make them more comparable across companies. However, we changed this in more recent seasons to preserve ranking structure.
Interpret with caution: Some companies have changed ranking systems over time. We initially tried to standardize ranks for analysis purposes (such as labeling the “demi-soloist” rank from some companies as “second soloist”). More recently, we have decided to report actual rank names. There may be inconsistencies due to this.
The larger companies are noticeably “bottom heavy,” with more corps dancers than smaller companies with similar amounts of soloists and principals. In bottom heavy companies, more people compete for each individual soloist and principal spot. Even after staying in the company for many years, the artistic staff may hire someone new as a soloist or principal for their first season with the company. Theoretically, you have a better chance of climbing the ranks in a “top heavy” company. However, this is better addressed by looking at promotion rates between different companies.
Additionally, the corps dancers in larger companies are mostly women. This supports the idea that ballet companies do not need as many male corps members for their repertoire. Male ensemble dances are generally less common in the classical ballet canon. For example, Houston Ballet has several these male ensemble dances in director Stanton Welch’s choreography, but this fact is not necessarily reflected in its number of male corps members.
9.1.2 On Ranking
Houston Ballet, Ballet West, and Sarasota Ballet are some of the most tiered companies included in our analysis. Joffrey Ballet and Ballet Austin, at the other extreme, have no formal ranks. The system most beneficial for dancers is not readily apparent.
More ranks likely mean more opportunities for small bumps in pay. While companies are not transparent when it comes to pay, salary is generally linked to dancer rank and seniority (there are, of course, exceptions). Ranked systems also create expectations in terms of roles. A principal dancer will generally dance principal roles, with a few soloist parts thrown into the mix. For many companies, this expectation is written into dancer contracts.
Joffrey claims this last point as an advantage of their unranked system. Theoretically, anyone in the company, regardless of experience, could be cast in lead roles. Nonetheless, certain people are still favored for lead roles, just as in a ranked company. We currently do not have data showing if the time to first performance of a principal role is shorter for dancers at unranked companies. It is also unclear how unranked companies differ from ranked companies in terms of pay scaling.
9.2 How long do dancers stay at a company?
Below is an interactive histogram that shows how long dancers stayed at a particular company. This is related to time to promotion and company turnover rate each season.
Danger
Interpret with caution: Some companies do not have complete bios for all dancers on their websites. For some companies (namely Sarasota Ballet), there may be missing information on how long dancers have been with the company if they are not certain ranks.
9.3 How many new dancers spots are filled internally versus externally?
When trying to join companies, dancers generally have no idea how many spots the artistic director is looking to fill each year. There are two main pools of talent: internal hires from the school or second company and external hires from auditions. External hiring can be further broken down between invitation-only company class auditions and that notorious free-for-all, “cattle call” auditions.
External dancers trying to break into a new organization have to spend a considerable amount of time and money traveling to auditions with no clear idea of their true chances.
9.3.1 What are my real chances?
We use data from past seasons as well as an interactive table to illustrate the hiring practices of different companies.
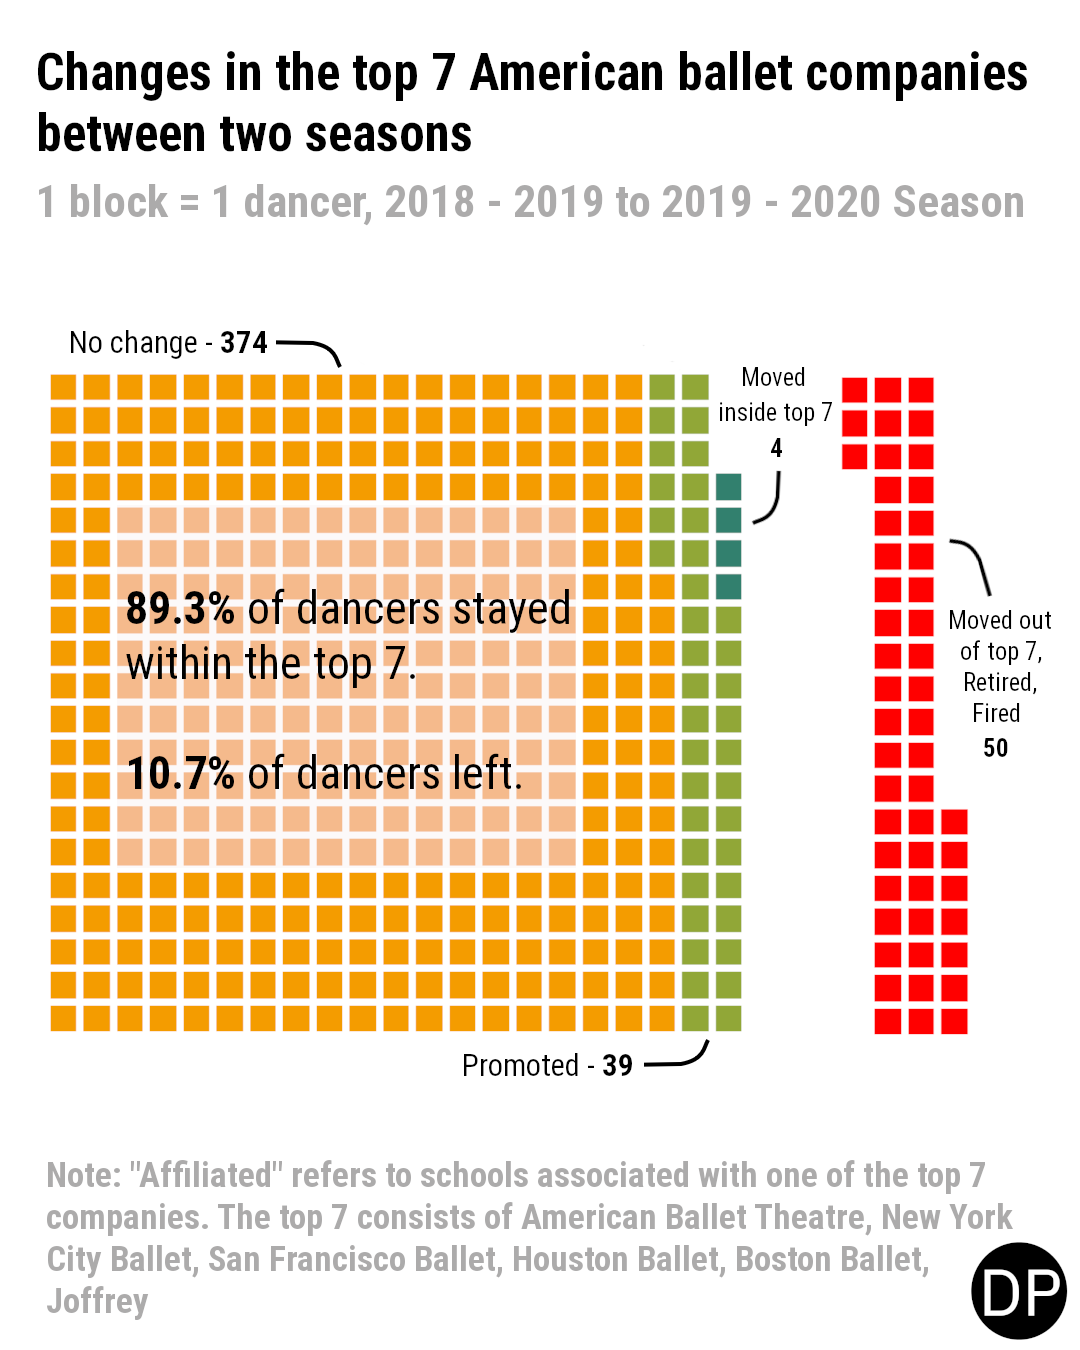
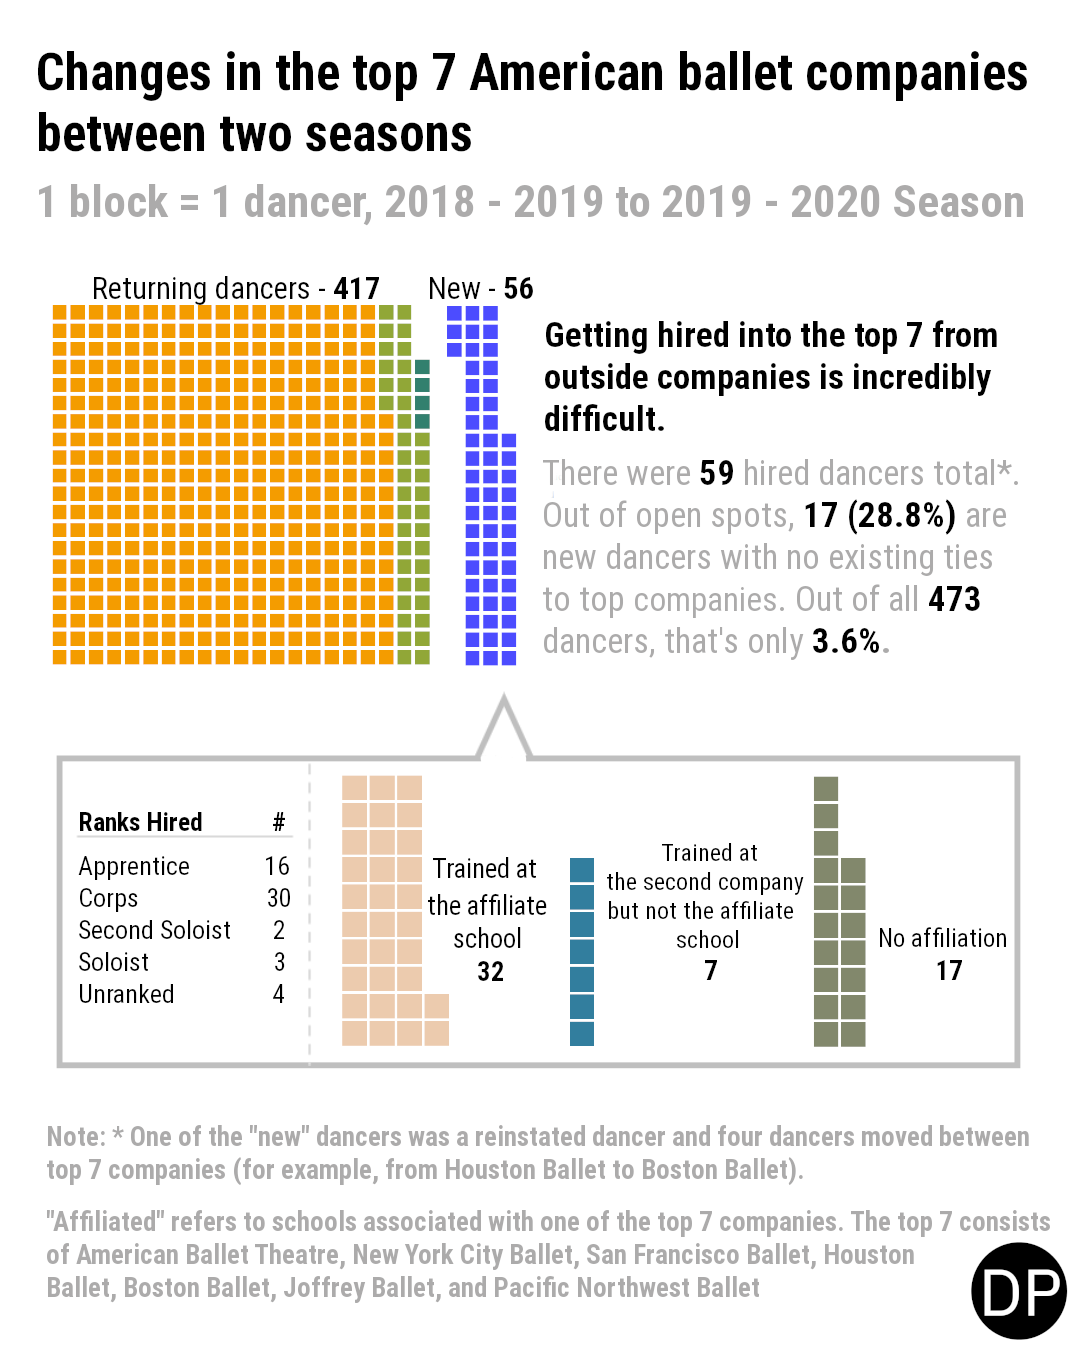
In the seven largest US ballet companies (American Ballet Theatre, Boston Ballet, Houston Ballet, Joffrey Ballet, New York City Ballet, Pacific Northwest Ballet, San Francisco Ballet) for the Season 2018 - 2019, there were 467 dancers employed.
417 returned (89.3%) and 50 left (10.7%; moved out of the top seven, retired, or were fired).
473 were employed by those same seven companies in Season 2019 - 2020.
59 (12.5%) hiring events happened between those seasons:
4 people moved between companies within the top seven
55 dancers from outside the top seven companies were hired (1 of these was a reinstatement)
39 hired had previous ties to the company (or 38, not counting the reinstatement)
32 received training from the affiliate school (or 31, not counting the reinstatement)
7 did not attend the affiliate school but were part of the affiliated second company
17 were completely unaffiliated with the top seven companies before joining
Therefore, less than a third of open spots were filled by dancers breaking into the top seven companies.
9.3.2 But what does this all mean?
Other analyses show that training at the affiliated school offers a huge advantage for being hired by particular companies. We did not know how affiliate school training impacted a dancer’s chances of being hired season to season. The data makes it abundantly clear that a dancer’s chances of breaking into the top seven companies from an external path are very slim. Considering the number of dancers seen over the course of the audition season, you must be exceptional to be considered.
The take-home message is to be realistic about your chances. You probably should not limit your auditions to only these companies if you know you’ll need a job next season. Going to all of the top seven’s open auditions is likely not a good idea, financially.
Season
Leavers
Joiners
2019
50
57
2020
135
79
2021
118
123
2022
157
193
Number of dancers leaving and joining recorded companies since the preceding season. The 2019 season only includes the top 7 US companies by domestic budget. Milwaukee Ballet was not tracked the 2020 season. Does not include second company programs, NYCB apprentices, or special ranks (like guest principal).
Season
No Affiliation
Not Enough Data
Went to School
Went to School & Second Company
Went to Second Company
2019
21
1
17
12
6
2020
29
15
13
7
15
2021
65
8
15
9
26
2022
90
8
30
26
39
Number of dancers joining recorded companies since the preceding season. The 2019 season only includes the top 7 US companies by domestic budget. Does not include second company programs, NYCB apprentices, or special ranks (like guest principal).
9.3.2.1 Number of Dancers Joining All Companies Recorded Broken Down By Season, Company, Rank, Group, & Gender
9.4 Which companies consider each other to be equals?
As we’ve already seen, dancers often move between companies. By gathering data over the seasons, we can look at movers among the top 26 companies and see if certain companies prefer movers from certain other companies. Currently, we are limited to movers within the top 26 (a dancer moving from Royal Ballet to San Francisco Ballet would not be counted), but we are looking to collect such data in the future.
9.4.0.1 Hiring Between the Top 26 Companies for All Seasons
The plot below shows dancers moving between companies. Hover over connections for detailed information. All numbers are numbers of dancers.
9.5 What are the characteristics of dancers who leave these companies?
Season
No Affiliation
Not Enough Data
Went to School
Went to School & Second Company
Went to Second Company
2018
38
6
4
1
2019
45
77
6
3
3
2020
60
14
18
6
18
2021
84
16
26
5
25
Number of dancers leaving recorded companies since the preceding season. The 2018-2019 season only includes the top 7 US companies by domestic budget. Does not include second company programs, NYCB apprentices, or special ranks (like guest principal).
9.5.0.1 Number of Dancers Leaving All Companies Recorded With Years At Company Broken Down By Company, Rank, & Group